📊 Benchmarks
TechEmpower
TechEmpower provides a performance comparison of many web application frameworks that execute fundamental tasks such as JSON serialization, database access, and server-side template rendering.
Each framework runs under a realistic production configuration. Results are recorded on both cloud instances and physical hardware. The test implementations are community contributed and live in the FrameworkBenchmarks repository.
- Fiber
v3.0.0 - 56 Cores Intel(R) Xeon(R) Gold 6330 CPU @ 2.00GHz (Three homogeneous ProLiant DL360 Gen10 Plus)
- 64GB RAM
- Enterprise SSD
- Ubuntu
- Mellanox Technologies MT28908 Family ConnectX-6 40Gbps Ethernet
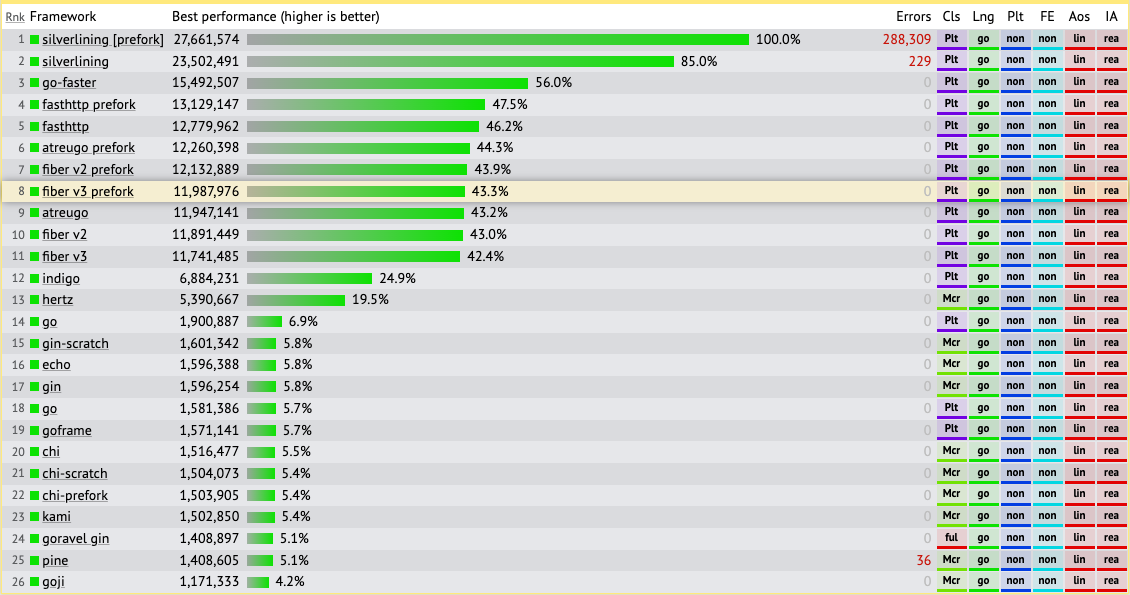
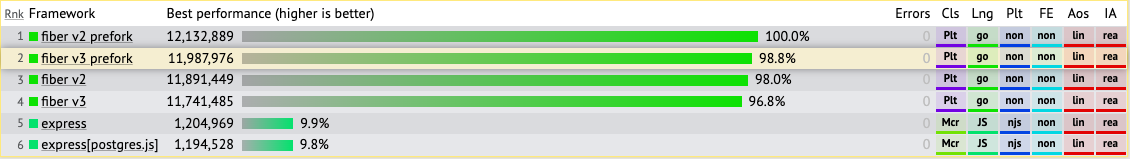
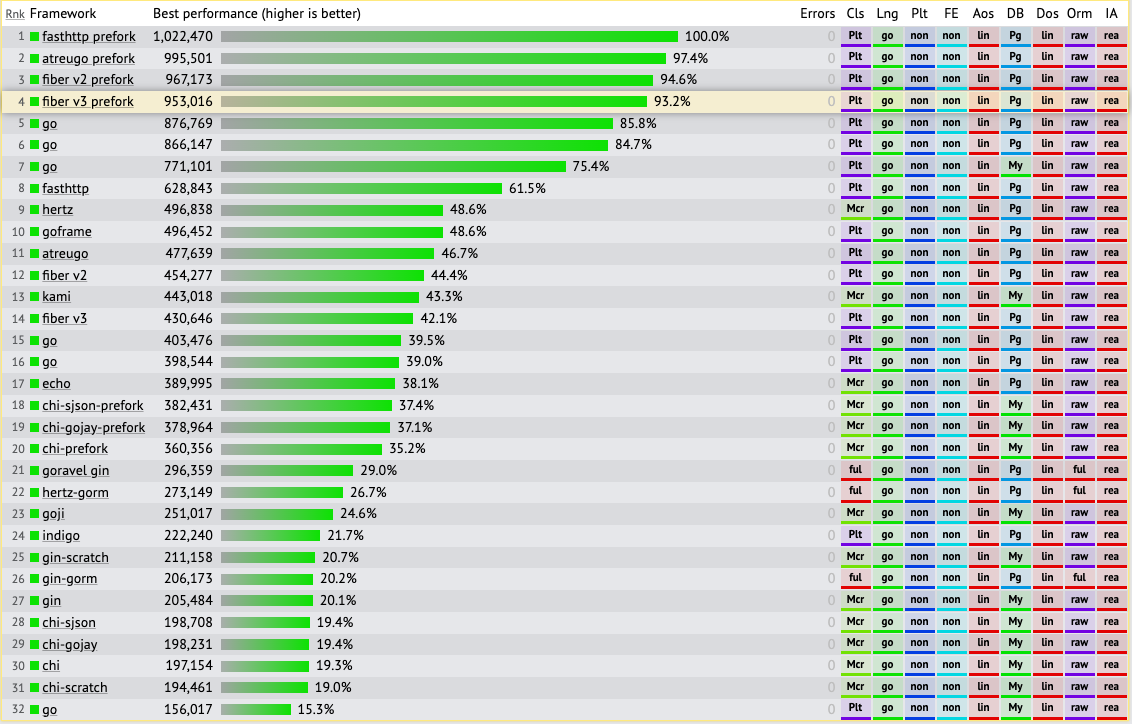
Plaintext
The Plaintext test measures basic request routing and demonstrates the capacity of high-performance platforms. Requests are pipelined, and the tiny response body demands high throughput to saturate the benchmark's gigabit Ethernet.
Fiber - 11,987,976 responses per second with an average latency of 1.0 ms. Express - 1,204,969 responses per second with an average latency of 8.8 ms.
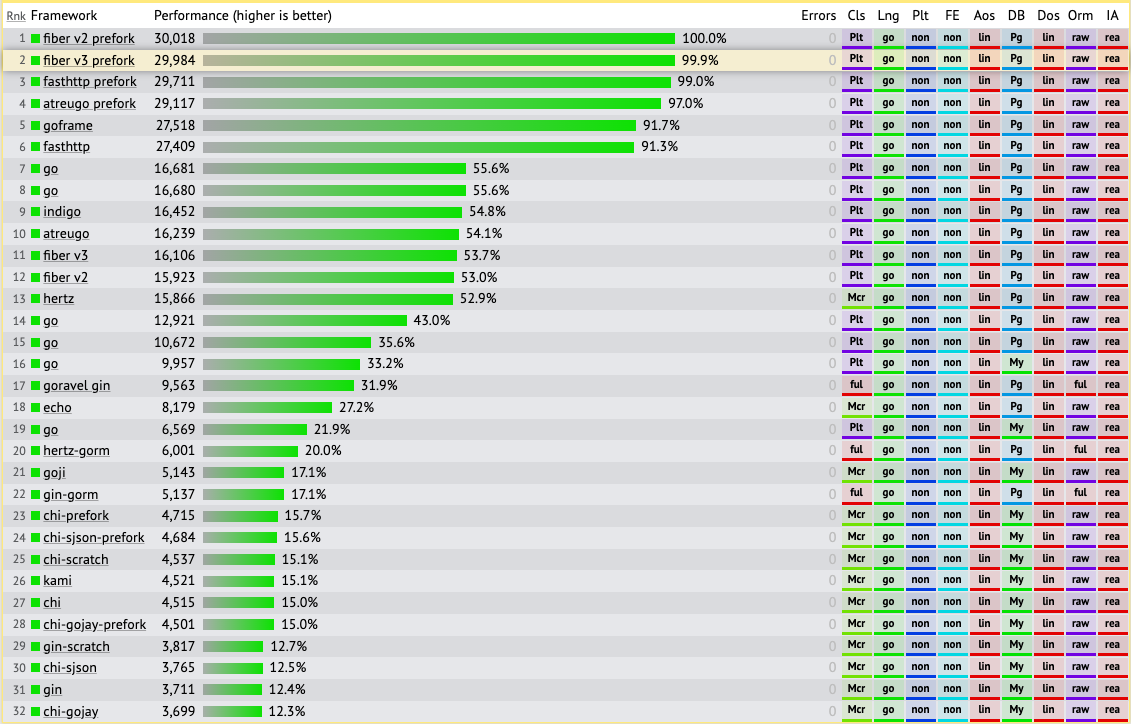
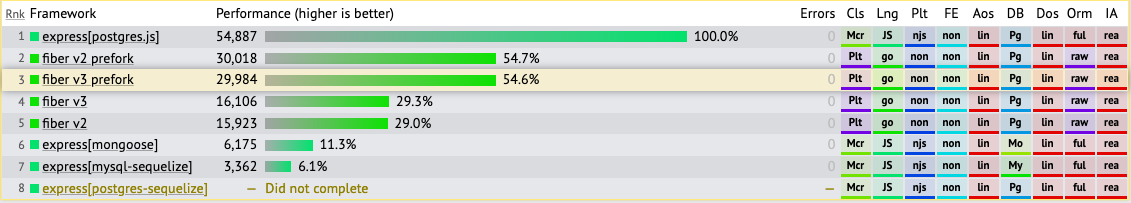
Data Updates
Fiber handled 29,984 responses per second with an average latency of 16.9 ms. Express handled 54,887 responses per second with an average latency of 9.2 ms.
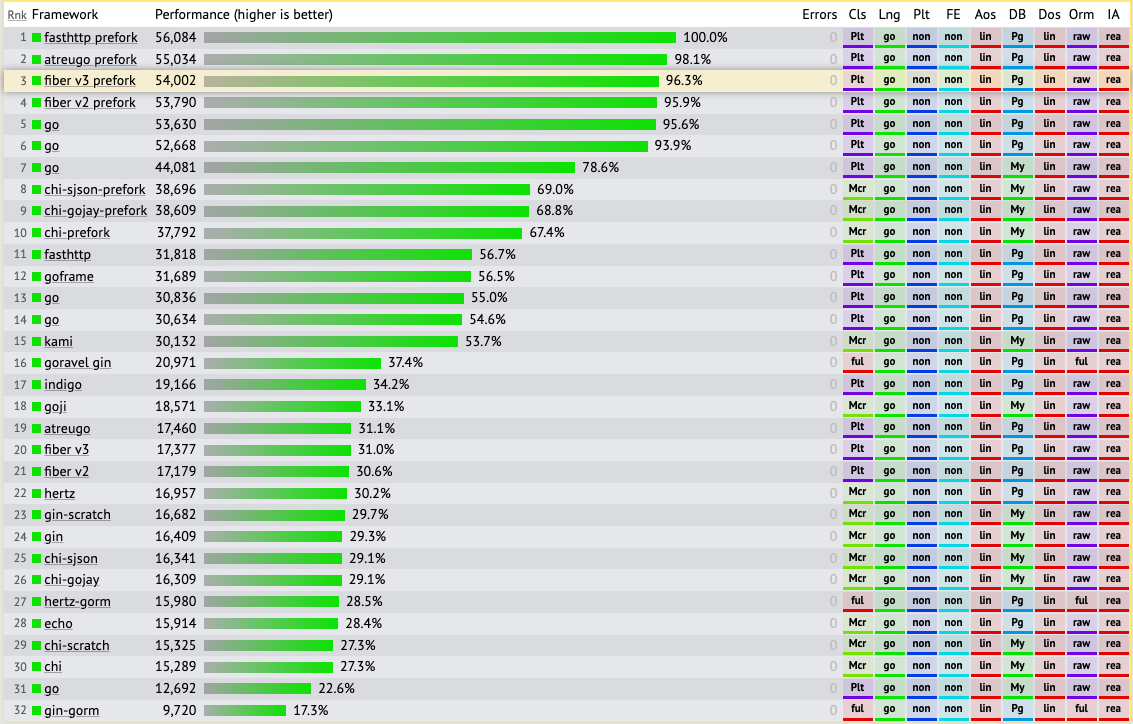
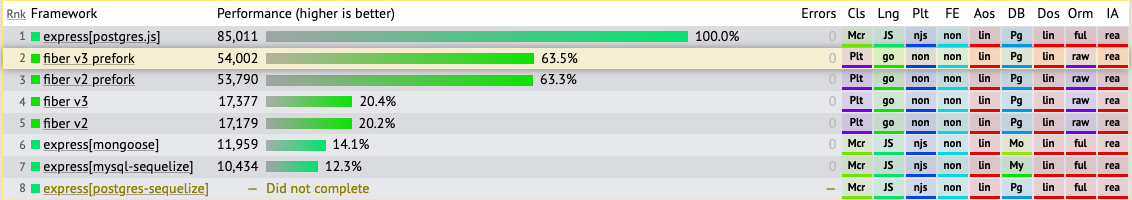
Multiple Queries
Fiber handled 54,002 responses per second with an average latency of 9.4 ms. Express handled 85,011 responses per second with an average latency of 6.0 ms.
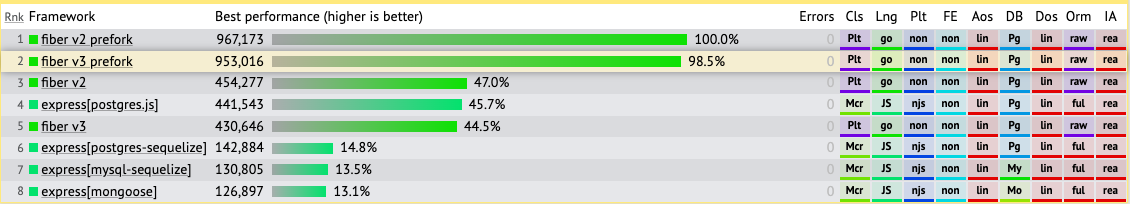
Single Query
Fiber handled 953,016 responses per second with an average latency of 0.6 ms. Express handled 441,543 responses per second with an average latency of 1.3 ms.
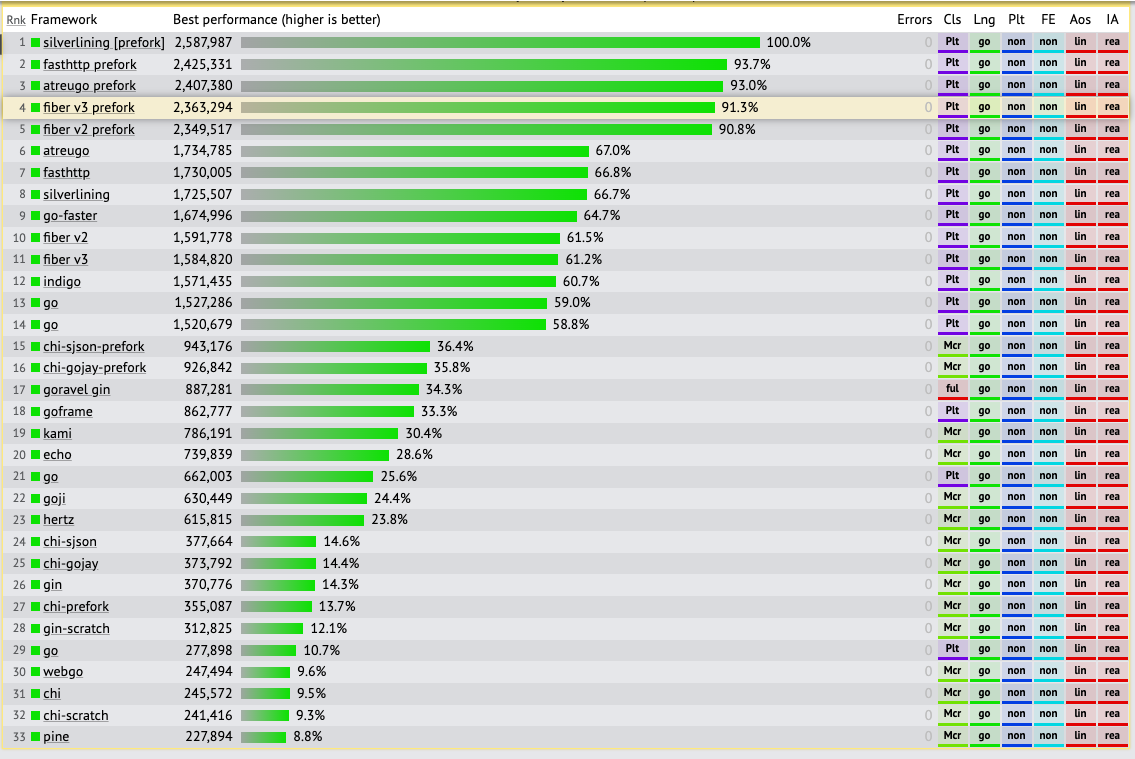
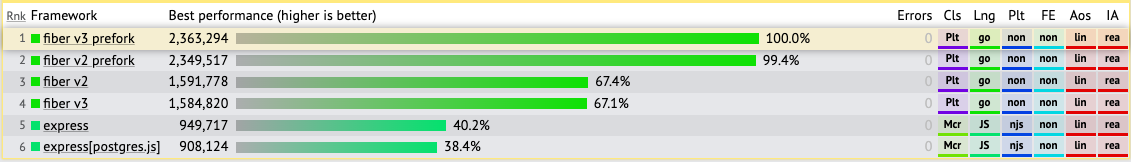
JSON Serialization
Fiber handled 2,363,294 responses per second with an average latency of 0.2 ms. Express handled 949,717 responses per second with an average latency of 0.5 ms.