Monitor



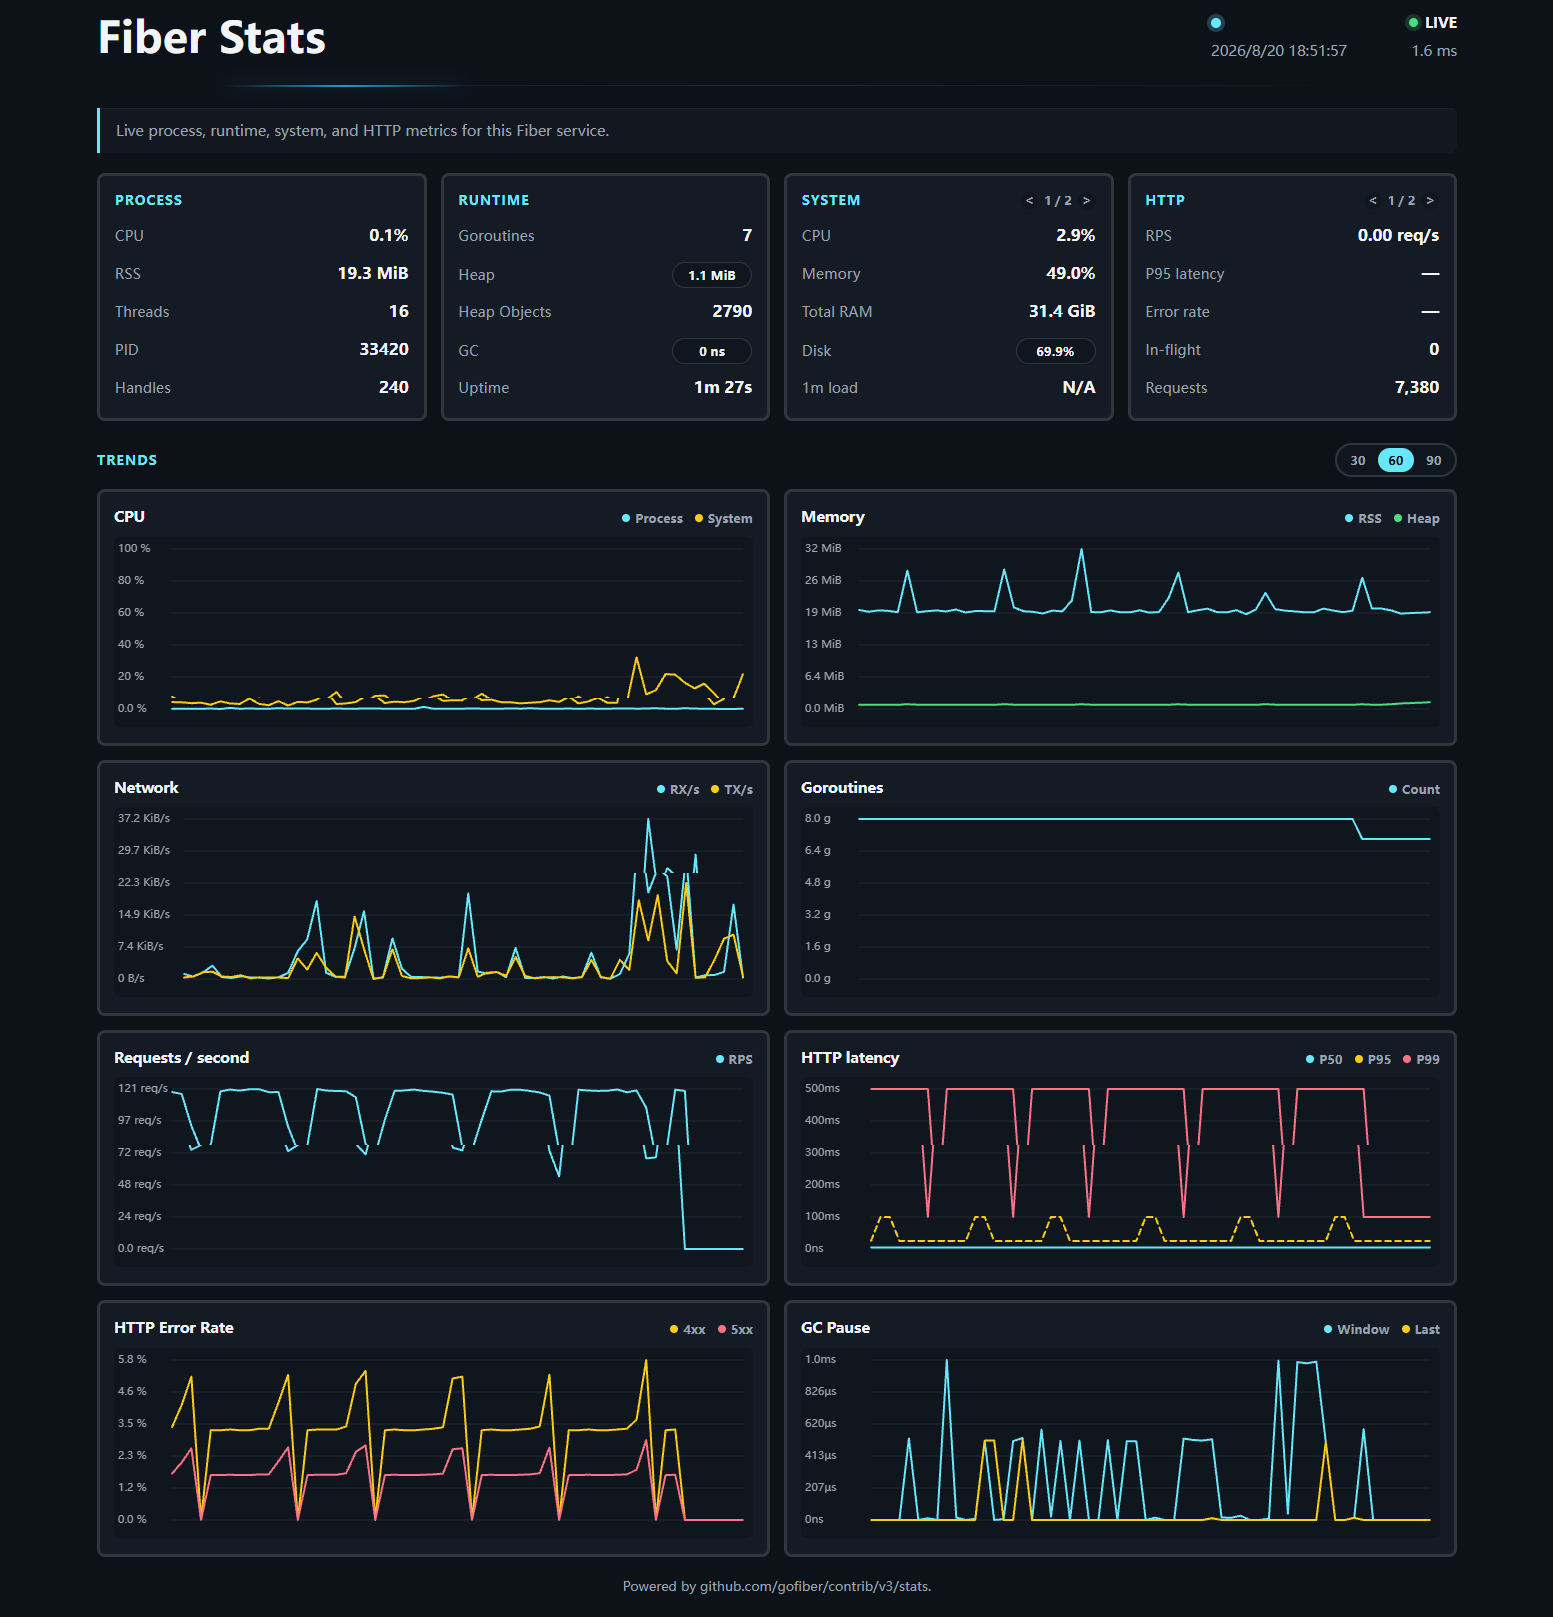
Monitor is a Fiber middleware that exposes real-time process, Go runtime, system, and HTTP service metrics through a built-in dashboard and JSON snapshot.
The v3 monitor dashboard has been redesigned with an embedded,
dependency-free UI and richer runtime and system metrics. Existing
monitor.New(config...) usage remains source compatible.
Monitor does not persist metrics, run a background collection loop, or replace Prometheus, OpenTelemetry, or an APM.
Compatible with Fiber v3.
Preview
Install
go get github.com/gofiber/contrib/v3/monitor
Signature
monitor.New(config ...monitor.Config) fiber.Handler
Usage
The existing route-mounted form continues to serve HTML and JSON at whichever path you choose:
app.Get("/metrics", monitor.New())
Request the same endpoint with Accept: application/json to receive the raw
snapshot. A route-only mount does not see application traffic, so its HTTP
request metrics remain empty.
To collect HTTP metrics for the whole application, mount one monitor instance
app-wide and use Next to pass non-monitor requests downstream:
package main

import (
    "github.com/gofiber/contrib/v3/monitor"
    "github.com/gofiber/fiber/v3"
    "github.com/gofiber/fiber/v3/log"
    "github.com/gofiber/fiber/v3/middleware/recover"
)

func main() {
    app := fiber.New()

    app.Use(monitor.New(monitor.Config{
        Next: func(c fiber.Ctx) bool {
            return c.Path() != "/metrics"
        },
    }))

    app.Get("/", func(c fiber.Ctx) error {
        return c.SendString("Hello, World!")
    })

    log.Fatal(app.Listen(":3000"))
}
Open http://localhost:3000/metrics. Requests for the monitor endpoint itself
are not included in the HTTP metrics.
For production deployments, protect the endpoint with authentication, network restrictions, or a reverse proxy. Place endpoint-specific authentication before monitor:
app.Use("/metrics", authMiddleware)
app.Use(monitor.New(monitor.Config{
    Next: func(c fiber.Ctx) bool { return c.Path() != "/metrics" },
}))
When the application uses Fiber's recover middleware, place it after monitor so
recovered panics are observed as 5xx responses:
app.Use(
    monitor.New(monitor.Config{
        Next: func(c fiber.Ctx) bool {
            return c.Path() != "/metrics"
        },
    }),
    recover.New(),
)
For instrumented requests that return an error, monitor invokes the
application's configured Fiber ErrorHandler before recording the response.
This makes status metrics match the response sent to the client, including
custom error statuses. The error is therefore consumed at the monitor layer and
does not propagate to middleware mounted before it.
Config
app.Use(monitor.New(monitor.Config{
    Next: func(c fiber.Ctx) bool { return c.Path() != "/metrics" },
    Title:       "My Service",
    Description: "Live runtime and HTTP statistics.",
    Footer:      "Internal operations dashboard.",
    FaviconURL:  "/assets/favicon.svg",
    Refresh:     3 * time.Second,
}))
| Field | Type | Default | Description |
|---|---|---|---|
Next | func(fiber.Ctx) bool | nil | Passes matching requests downstream and includes them in HTTP metrics. A false result serves monitor on the current path. |
Title | string | Fiber Monitor | Document title and dashboard heading. |
Description | string | See ConfigDefault | Text displayed below the heading. |
Footer | string | See ConfigDefault | Text displayed at the bottom of the page. |
FaviconURL | string | Built-in SVG | Root-relative path or absolute HTTP(S) URL. |
Refresh | time.Duration | 3s | Browser polling interval and server snapshot cache TTL; values below 1s are clamped. |
APIOnly | bool | false | Returns JSON regardless of the request Accept header. |
EnableGCPauseMetrics | bool | false | Enables exact last/window/total GC pause metrics through runtime.ReadMemStats, which briefly stops the Go runtime. |
CustomHead | string | Deprecated | Retained for source compatibility and ignored by the embedded dashboard. |
FontURL | string | Deprecated | Retained for source compatibility; no external font is loaded. |
ChartJSURL | string | Deprecated | Retained for source compatibility; charts use the built-in Canvas implementation. |
Default runtime metrics use runtime/metrics and avoid the explicit
stop-the-world snapshot performed by runtime.ReadMemStats. Applications that
need exact GC pause totals and the GC Pause trend can opt in:
app.Use(monitor.New(monitor.Config{
    Next:                 func(c fiber.Ctx) bool { return c.Path() != "/metrics" },
    EnableGCPauseMetrics: true,
}))
JSON
Request the monitor endpoint with an explicit JSON accept header:
curl -H "Accept: application/json" http://localhost:3000/metrics
The snapshot contains these groups:
{
  "collected_at": "2026-08-20T00:00:00Z",
  "collection": { "partial": false, "errors": [] },
  "process": { "cpu_percent": 1.25, "rss_bytes": 67108864, "tcp_connections": 12, "uptime_seconds": 3600 },
  "runtime": { "goroutines": 8 },
  "system": { "cpu_percent": 25.5, "memory_used_bytes": 8589934592, "memory_total_bytes": 17179869184, "load1": 0.75, "tcp_connections": 42 },
  "http": { "requests": 128 },
  "pid": { "cpu": 1.25, "ram": 67108864, "conns": 12, "goroutines": 8, "requests": "128", "uptime": 3600 },
  "os": { "cpu": 25.5, "ram": 8589934592, "total_ram": 17179869184, "load_avg": 0.75, "conns": 42 }
}
Unsupported, failed, and not-yet-available window metrics are encoded as
null, not as a synthetic zero. Collection failures expose stable identifiers
such as system.disk; raw operating-system errors and paths are not returned.
Migration notes
Existing monitor.New(config...) usage remains source compatible.
The process / runtime / system / http structure remains the primary
JSON representation. The response also includes legacy pid / os
compatibility views derived from those primary values:
| Legacy field | Primary field |
|---|---|
pid.cpu | process.cpu_percent |
pid.ram | process.rss_bytes |
pid.conns | process.tcp_connections |
pid.goroutines | runtime.goroutines |
pid.requests (string) | http.requests |
pid.uptime | process.uptime_seconds |
os.cpu | system.cpu_percent |
os.ram | system.memory_used_bytes |
os.total_ram | system.memory_total_bytes |
os.load_avg | system.load1 |
os.conns | system.tcp_connections |
Legacy numeric fields keep their original non-null JSON types and use zero
when a nullable primary value is unavailable; the primary field remains null
and collection.errors reports collection failures.
Route-mounted monitor instances still serve the dashboard and JSON snapshot,
but application HTTP metrics require the app-wide Next setup shown above.
Monitor endpoint requests are no longer counted as application traffic.
Metrics
| Group | Metrics |
|---|---|
| Process | CPU, RSS, threads, file descriptors/handles, TCP connections, runtime since monitor initialization |
| Go runtime | Goroutines, heap allocation/system/in-use/idle/released memory, heap objects, Next GC, mallocs/frees, GOMAXPROCS, GC count, optional last/window/total GC pause, GC CPU fraction |
| System | CPU, used/available/total memory, application-filesystem usage/type/free space, 1/5/15-minute load averages, aggregate network rates, TCP connections |
| HTTP | Requests, in-flight requests, 1xx–5xx status classes, RPS, 4xx/5xx rates, P50/P95/P99 latency |
CPU, network, request-rate, status-rate, and latency values need two collection
windows. Their first snapshot is null.
Exact GC pause metrics are null unless EnableGCPauseMetrics is true; when
enabled, the first window pause is also null while its baseline is
established. While they are disabled, the GC Pause trend explains how to
enable them.
Snapshots are collected only when JSON is requested and are shared within the configured refresh TTL. The dashboard keeps at most 90 trend samples in browser memory and displays 60 by default. The 30/60/90 selector changes only the visible browser history and remembers the choice in local storage.
The dashboard stops polling while its browser tab is hidden and refreshes as
soon as the tab is visible again, so a forgotten tab does not keep triggering
collections. A snapshot request that takes longer than the refresh interval, or
10 seconds if that is longer, is aborted and the dashboard reports its data as
stale. A PARTIAL status lists the metric groups that could not be collected
in its tooltip.
The eight trend panels cover CPU, memory, network, goroutines, requests per second, HTTP latency, HTTP error rates, and GC pauses. Heap, GC, application-filesystem, and HTTP status-code buttons open detailed views without triggering extra collection. Disk details never expose the filesystem path, mountpoint, or device name.
Performance
Run all benchmarks with:
go test -run='^$' -bench=. -benchmem
The cold-collection benchmarks include platform-specific gopsutil calls and are expected to vary between operating systems and machines. Results are intended for regression tracking, not as production throughput guarantees.
Security
This middleware exposes operational information and should be treated as a protected administrative endpoint.
Monitor does not implement authentication. Protect it with Fiber middleware, a reverse proxy, a private network, VPN, or firewall.
Monitor records aggregate counters only. It does not collect request or response bodies, headers, cookies, authorization values, query strings, route parameters, client IPs, user identifiers, environment variables, command lines, filesystem paths, or device names.
Notes
- Each
Newcall owns independent counters, histogram, cache, and sampling baselines. - Middleware instances are safe for concurrent use after construction.
- The business-request hot path uses time reads and atomic operations; system and runtime collection is not performed there.
- The embedded dashboard has no external JavaScript, CSS, font, or chart dependency.
- It initially follows the browser color scheme and provides a persisted Light/Dark toggle.
- Detail views are native modal dialogs, charts expose their latest values to assistive technologies, and on touch screens a tap or horizontal drag on a chart shows its values.
- Linux, macOS, and Windows are supported with graceful degradation when a metric is unavailable. Load averages are intentionally unsupported on Windows because gopsutil's Windows implementation starts a background sampler.
